Are tech layoffs and H-1B rules sinking home prices? Only in Seattle
Short answer: Tech layoffs and H-1B rules are widely blamed for falling home prices in tech suburbs. Across 17,982 US ZIP codes, neighbourhoods with more Indian-born residents saw clearly larger home-price falls only in Seattle: the quarter with the most were down 2.7% over the year to August 2026, against 0.0% for the quarter with the fewest. North of Dallas, Collin County is falling fast (-4.6% against -1.1% for the rest of the metro), but its falls follow new-house building, not where Indian families live. Indian-born share is not the same as H-1B status, and the data shows a pattern, not a cause.
The story has been told many times this year: tech layoffs and tighter H-1B rules are pushing Indian engineers out of American suburbs, and the houses they bought are going with them. North of Dallas, where new estates were sold to H-1B households through the pandemic, it has become the standard explanation for falling prices.
It is a checkable claim, so we checked it. We matched 17,982 US ZIP codes to three public sources: Zillow's home values to August 2026, the Census Bureau's count of residents born in India, and the Census count of how many homes in each ZIP were built since 2010. Then we asked a narrow question: do neighbourhoods with more Indian-born residents have falling home prices, once you compare them with similar neighbourhoods?
The answer depends on the city, and it is not the city the story is usually about.
#Key findings
- Seattle: the quarter of ZIP codes with the most Indian-born residents lost 2.7% of their home value in the year to August 2026; the quarter with the fewest was flat. The link holds under every comparison we ran.
- Dallas: Collin County is falling fast (-4.6% against -1.1% for the rest of the metro), but the falls follow new-house building, not where Indian families live. Irving, 36% Indian-born in one ZIP, is flat.
- Elsewhere: the Bay Area, Austin and Phoenix show no consistent link.
- Washington layoffs: tech employers filed WARN notices for 8,120 jobs in 2026 so far, and 3,765 of them came from four companies that have said AI now does work people did.
#Dallas and Collin County home prices: H-1B buyers or new houses?
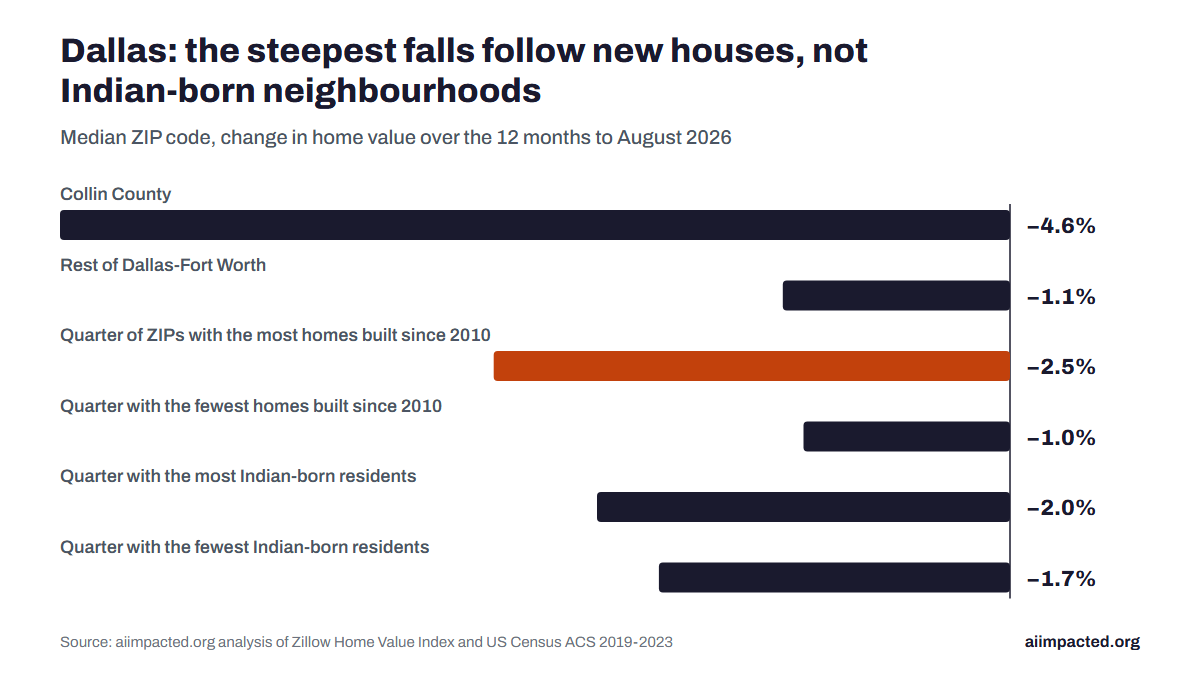
Collin County, the northern suburbs of Dallas, is falling faster than the rest of the metro. That part of the story holds.
| Dallas-Fort Worth, median ZIP | Last 12 months | From 2022-23 peak |
|---|---|---|
| Collin County (28 ZIPs) | -4.6% | -10.8% |
| Rest of the metro (224 ZIPs) | -1.1% | -6.6% |
| Quarter of ZIPs with the most Indian-born residents | -2.0% | -7.8% |
| Quarter with the fewest | -1.7% | -6.5% |
| Quarter with the most homes built since 2010 | -2.5% | -10.1% |
| Quarter with the fewest | -1.0% | -6.7% |
Free to reuse under CC BY 4.0 with the credit: Source: aiimpacted.org analysis of Zillow Home Value Index and US Census ACS 2019-2023, aiimpacted.org
The neighbourhoods with the most Indian-born residents fell only slightly more than those with the fewest. The neighbourhoods with the most new houses fell much more. Inside Collin County itself, the share of Indian-born residents does not predict which ZIPs fell hardest at all; the share of new housing does.
Irving is the clearest case. It has one of the oldest and largest Indian communities in Texas - 36% of residents in ZIP 75063 were born in India - and its home values are flat over the year. Celina, a town of new estates on the county's northern edge, is down 9.2% in a year and 17.6% from its peak. Melissa and Little Elm are both around 18% below theirs.
That is what an oversupply looks like: prices falling hardest where the most houses were built for buyers who were expected to keep arriving. Whether those buyers stopped arriving because of H-1B rules, layoffs, mortgage rates or all three, the census data cannot separate. What it does show is that the long-established Indian neighbourhoods are not where Dallas is falling.
One qualification. If you compare only ZIPs at the same price level, a small link does appear across the Dallas metro: about 2 percentage points more decline over the year for every 10 points of Indian-born share. It vanishes when price level is left out, which is why we treat Dallas as mixed rather than as either a yes or a no.
#Seattle home prices: tech-worker suburbs are falling fastest
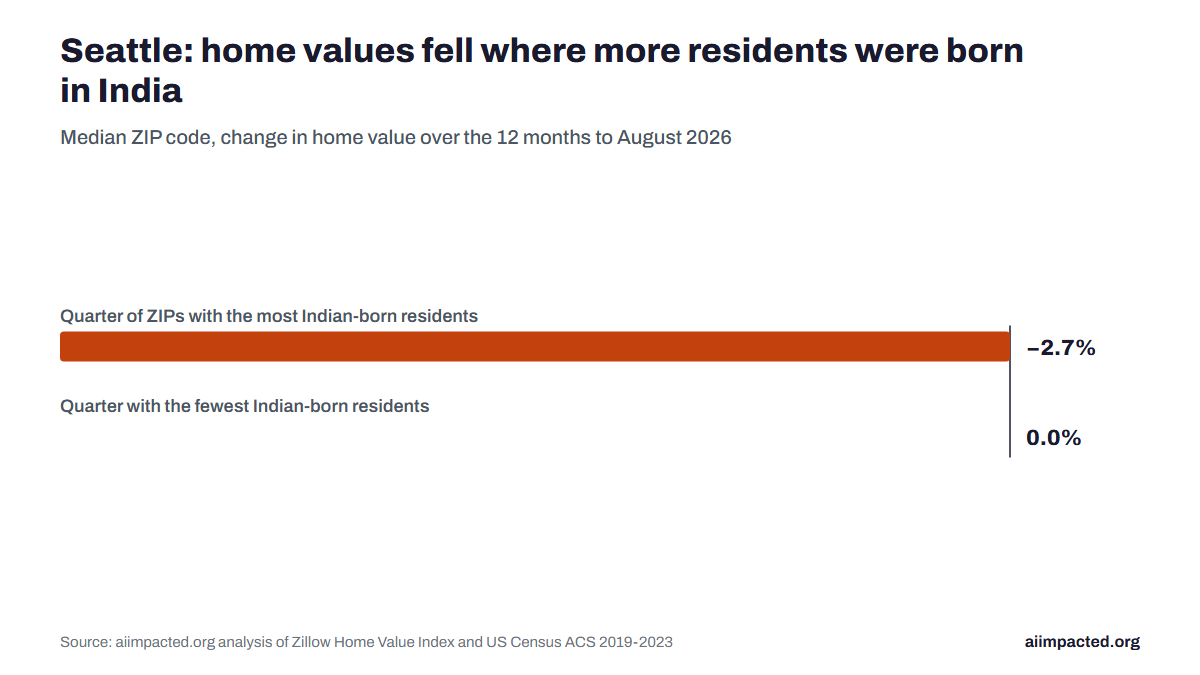
In the Seattle metro the link is strong and it does not depend on how the comparison is set up.
| Seattle-Tacoma, median ZIP | Last 12 months | From peak |
|---|---|---|
| Quarter of ZIPs with the most Indian-born residents | -2.7% | -8.6% |
| Quarter with the fewest | 0.0% | -1.9% |
Free to reuse under CC BY 4.0 with the credit: Source: aiimpacted.org analysis of Zillow Home Value Index and US Census ACS 2019-2023, aiimpacted.org
Every 10 points of Indian-born share goes with roughly 2 to 3 points more decline over the year, and 5 to 6.5 points more from the peak. That holds whether or not we account for new building, the 2020-22 run-up, or how expensive the ZIP is, and it holds after dropping the ZIPs with the highest shares.
These are the Eastside suburbs where Microsoft and Amazon staff live: Bellevue 98007 (23% Indian-born, down 4.5% in a year), Redmond 98052 (16%, down 4.0%), Sammamish 98074 (14%, down 5.9%), Issaquah 98029 (10%, down 5.1%).
#Tech layoffs in Washington: 8,120 jobs in WARN notices this year
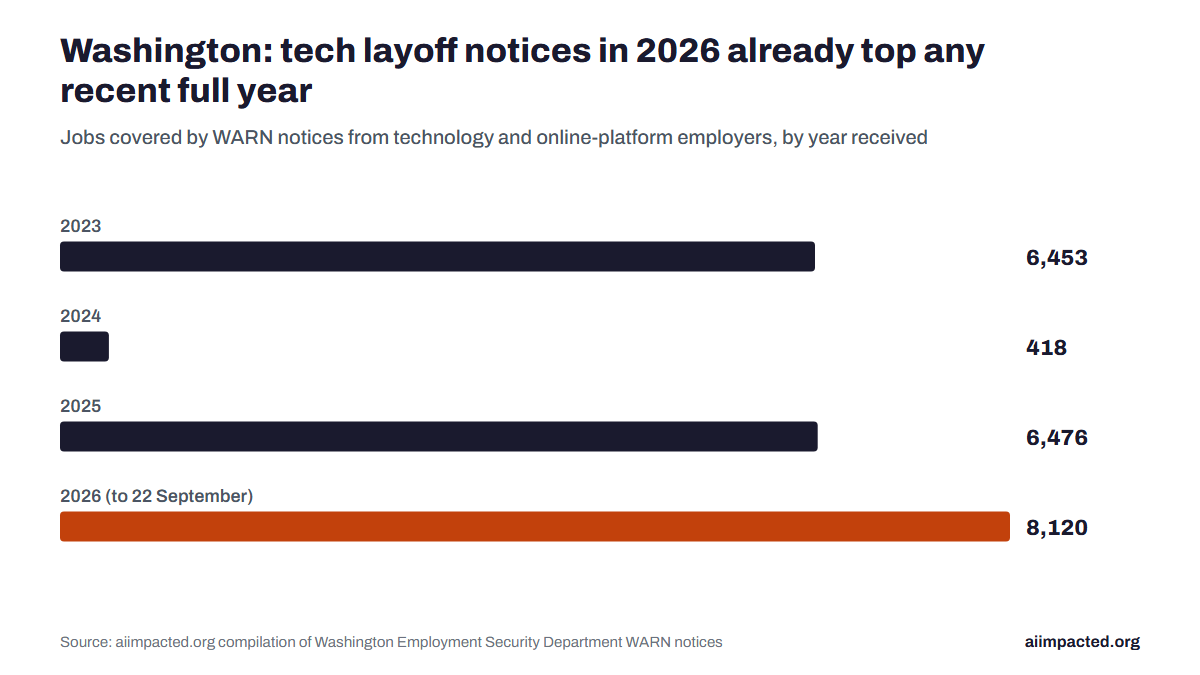
Washington's layoff notices put numbers on the other side of it. Under the WARN Act, employers must file a notice with the state before a large layoff; Washington publishes them, but only as a paged web table. We collected all 390 notices filed from September 2022 to September 2026. Technology and online-platform employers filed notices covering 8,120 Washington jobs in 2026 so far, already more than in all of 2023 (6,453) or 2025 (6,476).
Free to reuse under CC BY 4.0 with the credit: Source: aiimpacted.org compilation of Washington Employment Security Department WARN notices, aiimpacted.org
Almost half of this year's total, 3,765 jobs, came from four employers that have said publicly that AI now does work people used to do: Amazon, Oracle, Salesforce and Snap. Amazon's two notices for 2,599 Washington jobs were filed on 28 and 30 January, the same week it announced the 16,000 corporate cuts it tied to AI. Snap's notice arrived on 15 April, the day of its own announcement. Microsoft and Meta filed notices for 2,776 more; neither has said AI did the work. (Why that line matters, and which jobs employers have named, is in what jobs AI will not replace.)
The notices say nothing about AI themselves. What they establish is where and when the jobs went, which is the part a housing market feels.
#Why a layoff lands harder on an H-1B household: the green card queue
The reason a tech layoff can move a housing market at all is that many of the people cut cannot simply take the next job. An H-1B worker who is laid off has 60 days to find a new sponsor or leave the country, and for most Indian workers that status is the only one on offer for decades. US Citizenship and Immigration Services counted 351,142 Indian principal applicants approved and waiting for an EB-2 employment green card in March 2026, and 105,360 more in EB-3, according to its own petition data. With spouses and children, the National Foundation for American Policy puts the Indian queue at about 996,600 people as of December 2025, 79% of the entire employment-based backlog, in an August 2026 brief. Its worst-case arithmetic, the backlog divided by the annual per-country allocation, gives an Indian filing in EB-2 in 2026 a wait of 179 years; the real figure is shorter because unused numbers from other countries spill over, but it is still measured in decades.
That is the mechanism behind the Seattle result. A household in the queue that loses its sponsor has two months to sell or rent out a home, and the neighbourhoods where those households cluster are the ones where forced sales show up first. It also explains why the Dallas result is weaker: Irving's Indian community is older and more settled, with more citizens and green card holders who can wait a layoff out.
#All six comparisons in one table
The same test, run the same way in each place. "Holds up" means the link survives with and without each adjustment: new building since 2010, the 2020-22 price run-up, and how expensive the ZIP is.
| Area | ZIPs | 12-month change: most vs fewest Indian-born quarter | Holds up? | Our reading |
|---|---|---|---|---|
| Seattle-Tacoma | 142 | -2.7% vs 0.0% | Yes, in every version | Clear link; strongest of the six |
| Dallas-Fort Worth | 252 | -2.0% vs -1.7% | Only when comparing ZIPs at the same price level | Mixed; new building explains more |
| Bay Area | 204 | 0.0% vs +0.9% | No, swings from strong to nothing | No consistent pattern |
| Austin | 80 | -1.8% vs -4.4% | No | None; more Indian-born ZIPs fell less |
| Phoenix | 145 | -0.1% vs -1.6% | No | None |
| All US | 17,982 | +1.8% vs +2.3% | A small link after adjustments | Weak nationally; Seattle is the outlier |
#What this data does not show about H-1B workers
- Indian-born is not H-1B. The Census counts where people were born, not their visa. Many Indian-born residents are citizens or green-card holders. The share is the best public measure of where H-1B households are likely to live, and a good marker of the tech workforce generally. So the Seattle finding is best read as "tech-worker neighbourhoods are falling fastest", not "H-1B holders are leaving".
- It is a pattern, not a cause. Layoffs, falling stock-based pay, the $100,000 payment on new H-1B petitions introduced in September 2025 and later partly blocked in court, and mortgage rates all point the same way in the same places. This data cannot tell them apart.
- The Census figures run to 2023. They are the five-year 2019-2023 estimates, so a town that filled up after 2023 - Celina is the obvious one - will be undercounted.
- The Bay Area shows no consistent pattern. Its result swings from strong to nothing depending on which comparison is used, so we do not report one. Austin and Phoenix show none.
#If you work in tech and own, or want to buy, a home here
If you are in tech and weighing a purchase on Seattle's Eastside, the neighbourhoods where your colleagues live are the ones softening, and the WARN file shows notices still arriving for layoffs that start in late 2026. If you are looking north of Dallas, the risk is less about who your neighbours are than how many unsold new houses are around you: compare the share of recent building before comparing anything else.
#Use the data: ZIP-level home prices and WARN notices
Both files are below, free to use with credit. The ZIP file covers every US ZIP code with at least 2,000 residents and a Zillow value, so it can be cut for any metro, not only the ones here. The WARN file is the full Washington list, with a column marking the employers in our own record of AI-attributed job cuts.
Method. Home values are Zillow's Home Value Index for mid-tier homes, smoothed and seasonally adjusted: August 2026 against August 2025, and against each ZIP's highest month since June 2021. Indian-born share is Census table B05006 over total population (B01003); new-building share is homes built 2010 or later over all homes (B25034), all from the American Community Survey 2019-2023 five-year estimates. The metro comparisons are ordinary least-squares regressions of price change on Indian-born share, new-building share, the rise from December 2019 to the peak, and the log of current home value. We report a finding as firm only where it survives with and without each of those controls. The WARN list was collected from the Washington Employment Security Department on 28 September 2026.
Download the data
- Home-price change by ZIP code, US, to August 2026 (CSV) - 17,982 ZIPs, 12 columns
- Washington WARN layoff notices, Sep 2022 to Sep 2026 (CSV) - 390 notices, with our AI-ledger flag
Free to use with credit to AIimpacted, and to Zillow (Home Value Index) and the US Census Bureau (American Community Survey) for the underlying figures. Home-value columns are percentage changes; get dollar values from Zillow.
Questions people ask
- Are H-1B workers leaving making US home prices fall?
- Public data cannot show it directly, because no public source counts H-1B holders by neighbourhood. Using Indian-born residents as the closest proxy, Seattle's Eastside shows clearly larger price falls where the share is higher. Dallas does not: its steepest falls are in new-build towns such as Celina, while Irving, 36% Indian-born in one ZIP, is flat.
- Why are home prices falling in Collin County, Texas?
- The median Collin County ZIP was down 4.6% in the year to August 2026, against 1.1% for the rest of Dallas-Fort Worth. The falls track how much new housing was built since 2010 much more closely than who lives there, which points to oversupply in the new estates on the county's northern edge.
- How many tech jobs have been cut in Washington state in 2026?
- Technology and online-platform employers filed WARN notices covering 8,120 Washington jobs from January to 22 September 2026, more than in all of 2023 or 2025. Amazon, Oracle, Salesforce and Snap, which have each said AI now does work people did, account for 3,765 of them.
- Can I use this data?
- Yes. Both CSV files are free to use with credit to AIimpacted, and to Zillow and the US Census Bureau for the underlying figures. The ZIP file covers every US ZIP with at least 2,000 residents, so it can be used for any metro.
- Which Seattle-area ZIP codes have fallen most?
- In the year to August 2026 the steepest falls in the Seattle metro were in 98121 (Belltown, Seattle, -6.1%), 98074 (Sammamish, -5.9%), 98033 (Kirkland, -5.2%), 98029 (Issaquah, -5.1%) and 98011 and 98012 (Bothell, -5.0%), based on Zillow's mid-tier home value index. Three of them, Belltown, Sammamish and Issaquah, are between 10% and 14% Indian-born.
- Are home prices in Collin County, Texas still falling?
- Yes, as of August 2026. The median Collin County ZIP was down 4.6% over the year and 10.8% from its peak, against 1.1% and 6.6% for the rest of Dallas-Fort Worth. The steepest falls are in new-build towns such as Celina (-9.2% over the year) and Melissa and Little Elm (about 18% below their peaks). This describes past prices, not a forecast.
- How long is the green card wait for Indian tech workers?
- Decades for most. USCIS counted 351,142 Indian principal applicants waiting in the EB-2 employment category in March 2026 and 105,360 in EB-3. The National Foundation for American Policy estimates the Indian queue at about 996,600 people including families, 79% of the whole employment-based backlog, and puts the worst-case EB-2 wait for a 2026 filing at 179 years. An H-1B worker who is laid off while waiting has 60 days to find a new sponsor, which is why layoffs reach the housing market in tech suburbs.